Showing posts with label graphs. Show all posts

Friday, September 9, 2011

Welcome back! Let's kick it off with Daily Infographic.

Hello and welcome back everyone!  The first week of school is just about over!  I won't go on to tell you how many are left....but just know that it's going to be a GREAT year!

I wanted to post about a neat site I found just a few days ago: Daily Infographic.

So, what is an infographic, exactly?  Well, Information Graphics are simply visualizations of some form of data or knowledge.  It can be the results of a survey, a how-to method, or some other set of information.  The graphic part makes the info easily followed and pretty.

Daily Infographic publishes an infographic, found from the web, every weekday.  The topics vary greatly, but they are always jam packed with great information.  If you find one that relates to your lesson (and yes, the collection is searchable and "browse-able" by category!) you could literally take a whole class period to scroll through and discuss what's shown.

Here is an interesting example about jobs for recent grads...something to show seniors, maybe?
Click on it to enlarge:


Check out the site and even follow it to stay updated on the newest Infographic each day!

Friday, February 11, 2011

NCES Kids' Zone - Awesome Graphing Tool


The National Center for Education Statistics (NCES) has a section of their site called Kids' Zone.  It drew my attention the other day when I was shown (by a wonderful teacher) the graphing tool from the site, called Create a Graph.  I was blown away with how easy to use the tool is as well as what great graphs you are able to print from it. 


Create a Graph allows you to create bar graphs, line graphs (both of which can be turned into multiple bar or line graphs), area graphs, pie graphs, and xy coordinate graphs.  It is a simple process of working through simple tabs to set up the design, enter the data, and preview your graph.  Once it has been created, you can print it, download it as a picture file, or email it to yourself so you are able to edit it in the future.


The tool would be a great way to integrate graphing into your lessons; an important piece for students to gain an understanding of data.  Try collecting data from your own classroom and plot out the results!  How do the heights of boys vs. girls compare?  What have the temperatures been for the past week?  How many students in the class prefer pepperoni pizza over cheese?  Try it out as a class or have your students make their own!


Friday, March 26, 2010

Gapminder


Today's site is Gapminder, an online collection of extremely interesting statistics that show the facts of the world. As they are today,  but also as they have changed over time.  Browse from many different comparisons such as average life expectancy vs. income per person and then "play" the information to see the change over time from the 1800's to today.  Students are able to analyze the data, offer opinions, and closely examine the bubbles which represent the countries of our world.

Also check out the "For Teachers" tab that has quick links to the most educational uses of the site.

Thursday, March 25, 2010

Own Your C

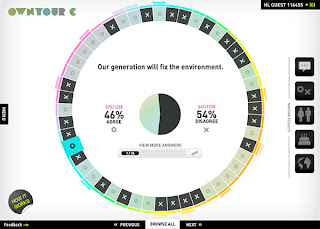
I found a pretty neat site for today...it's called Own Your C (the "C" stands for "choice" I'm guessing).  You can choose to sign up for an account or stay completely anonymous, but once you visit the site you will be presented with a question asking you your opinion (agree or disagree) on a health topic.  For instance, some of the statements I weighed in on were, "Chewing tobacco is no big deal." and "Using my cell phone while driving does not affect my performance."  Once you answer agree or disagree, you can see the results of other peoples' answers displayed in an attention-grabbing layout.  Then you can choose from different demographics (collected from only those who have signed up for a profile) to analyze the data in correlation to gender, age, etc.
I imagine that this would be a neat exercise to do with a health class or possibly a social class talking about current events.  Each student could use their own computer or the teacher could present this on the whiteboard.  Share any other ideas you may have for using this interesting site!